There Are Two Calendars.
You Hear About One.
Week of October 1 · BURL open · TSM & LIND inside
The loud one is on every screen: the Fed on the 27th, earnings on the 15th, CPI, payrolls[cite: 22]. The quiet one has been running since 1997 — and on Thursday it opened three windows that nobody reported[cite: 22].
The loud calendar is the one everybody trades[cite: 22]. By the time a date reaches it — a Fed decision, an earnings print, a CPI release — it is already priced[cite: 22]. You are not early. You are in the queue.[cite: 22]
The quiet one is the schedule underneath[cite: 22]. A company's order book fills in the same months[cite: 22]. Its shipping season lands in the same weeks[cite: 22]. Its tax year, its product cycle, its customers' budgets — all of it repeats, and barely moves from one year to the next[cite: 22]. When enough of those forces stack in the same stretch of weeks, the stock tends to move in that stretch[cite: 22]. Not every year[cite: 22]. But often enough to measure, and often enough to put a date on.[cite: 22]
That unreported schedule is a stock's quiet calendar[cite: 22]. We read it across more than twenty years of price history, on thousands of tickers, every week[cite: 22]. When it lines up you get a window — a start date, an end date, and the complete record of every previous time it came around, including the years it went wrong.[cite: 22] The board you knew showed four numbers on every pick. It now carries twelve.[cite: 22]
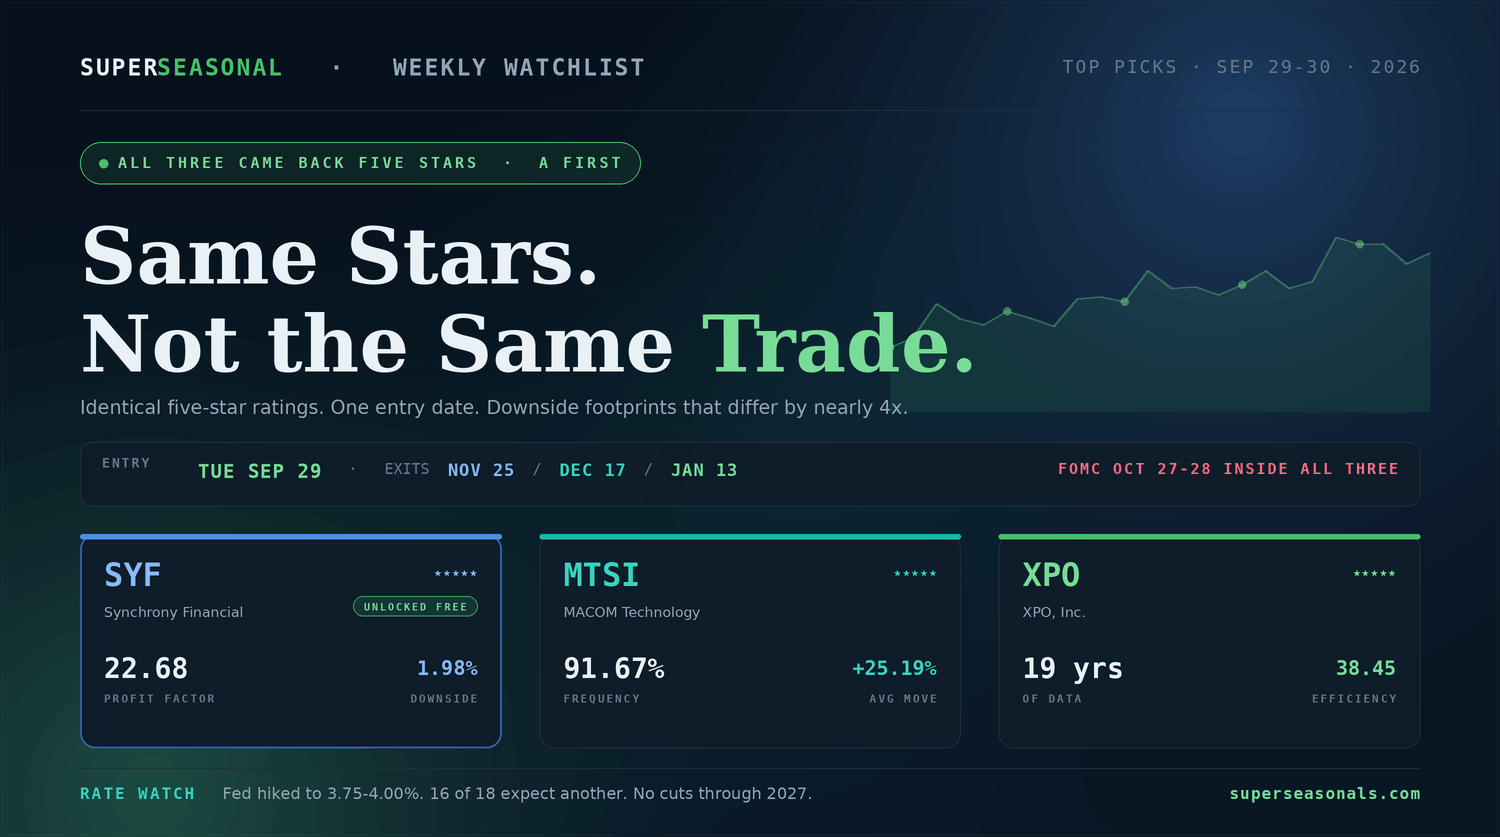
No cuts on the board through 2027
The Fed raised rates on September 16 for the first time since 2023 — unanimous, 12–0, to 3.75%–4.00%[cite: 22]. Sixteen of eighteen participants expect at least one more hike this year, four pencilled in two, and the median shows roughly 4.1% at year end and again through 2027[cite: 22].
That means no cuts projected at all over the forecast horizon, futures implying about 4.3% by December, and long-dated yields near twenty-year highs[cite: 22]. The next decision lands October 27–28 — inside every window here[cite: 22].
One window, open to you in full
BURL leads this week on three of the four dependability measures — a 92.31% frequency, a 19.38 profit factor and a 75% annual win rate — and pairs them with the tightest downside on the board at 2.90% sigma[cite: 22].
What makes the timing interesting is where the stock has been[cite: 22]. Burlington has fallen more than 30% from its July high, from $378 into the mid-$260s, with its RSI hitting a record low in early September[cite: 22]. The selling came from softer second-quarter comps and cautious third-quarter guidance — not from a broken business[cite: 22]. The most recent quarter was its fourteenth consecutive quarter of double-digit EPS growth, with adjusted EPS up 26% and full-year guidance raised to $11.77–$11.97[cite: 22]. Return on equity sits above 40%[cite: 22].
Twenty analysts average a $370.75 target against a $275 price — fourteen Buy, six Hold[cite: 22]. Morgan Stanley is Overweight at $432, Jefferies raised to $410, Goldman trimmed to $382 but kept its Buy[cite: 22]. Deutsche Bank is the bear at $323[cite: 22]. Independent fair-value work puts the stock around 13.5% undervalued[cite: 22].
Earnings land around November 24 — inside this 45-day window, and comps are exactly what the market is nervous about[cite: 22]. Insiders have sold roughly $16 million over the past twelve months with no recorded purchases[cite: 22]. A P/E near 23 still prices in continued execution[cite: 22]. The window also holds through the October 27–28 Fed decision[cite: 22].
Off-price retail is counter-cyclical by design — when household budgets tighten, Burlington's proposition improves[cite: 22]. That makes it the most naturally hedged name on this board against a Fed that is still raising[cite: 22].
The best risk-adjusted window of the three: top frequency, top profit factor, and the smallest risk footprint — on a stock down 30% from its high while still compounding earnings[cite: 22]. The caveats are an earnings print inside the window, steady insider selling, and comps the market is already worried about[cite: 22].
Twenty-eight years of the same October
This is the one that has kept the same autumn appointment since 1997 — the deepest record we have ever published, on a company that now makes roughly two-thirds of the world's advanced chips[cite: 22]. August revenue rose 53.3% year over year to a record NT$514.81 billion[cite: 22]. It carries five stars, one more than the window above[cite: 22]. And its downside band is close to twice as wide[cite: 22]. Those two facts belong together, and members see both[cite: 22].
Both dates, all twelve statistics, the catalyst, the risk flags and the bottom line continue inside Super Seasonal.
The biggest mover, and the longest hold
The biggest average move of the three and the longest hold on the board, running into the new year[cite: 22]. First-quarter revenue rose 16% on record 93% occupancy, and management raised full-year guidance in September while buying into high-end Antarctic expeditions[cite: 22]. All of that is attached to a set of downside numbers that decide whether it belongs in your account at a quarter of the size, or not at all[cite: 22].
Both dates, all twelve statistics, the catalyst, the risk flags and the bottom line continue inside Super Seasonal.
The three, side by side
| Ticker | Rating | Years | Freq. | Profit Factor | Hold | Worst Drawdown | Downside Σ |
|---|---|---|---|---|---|---|---|
| BURLBurlington · unlocked | 4 / 5 | 13 | 92.31% | 19.38 | 45d | -22.19% | 2.90% |
| TSMTaiwan Semiconductor | 5 / 5 | 28 | 00.00% | 0.00 | 00d | -00.00% | 0.00% |
| LINDLindblad Expeditions | 4 / 5 | 11 | 00.00% | 0.00 | 00d | -00.00% | 0.00% |
Unlock all three windows, 25% lighter.
Every plan carries the full weekly board, all twelve statistics on every pick, the backtest engine running to 1993, saved-filter email alerts, portfolios and exports[cite: 22].
Through Tuesday, code SS25 takes 25% off any plan[cite: 22].
Enter it at checkout. Ends Tuesday, October 6 at midnight.
Code SS25 applies 25% off at checkout and expires Tuesday, October 6 at midnight. Seasonal statistics describe past behaviour and do not guarantee future results.[cite: 22]
The five-star window is the roughest of the three.
TSM carries five stars and twenty-eight years of history[cite: 22]. BURL carries four stars and thirteen[cite: 22]. On the surface the five-star name looks like the safer one[cite: 22]. It is not.[cite: 22]
The goal was never to trade more[cite: 22]. It was to trade fewer, better-prepared ideas — and to spend the rest of the week not worrying about them[cite: 22].
The quiet calendar now comes to you.
When you were a member you had to come looking[cite: 22]. That is no longer how it works — and this is live today[cite: 22].
Set your filters once and we email you the moment a window matches them.[cite: 22] Reliability, profit factor, downside sigma, holding period, win rate[cite: 22]. Your criteria, your thresholds[cite: 22]. If nothing qualifies, you hear nothing[cite: 22].
The Big Picture
Three windows, one opening date, and three different jobs[cite: 22].
Notice what the ratings do not capture[cite: 22]. The five-star name has the roughest downside; the four-star name has the tightest.[cite: 22] Stars measure how much evidence stands behind a pattern[cite: 22]. The downside band measures what it costs you when the pattern fails[cite: 22]. Sizing a position requires the second answer, and it is the one almost nobody publishes[cite: 22].
All three hold through the October Fed decision and through their own earnings[cite: 22]. That is the shape of this particular week, and it is better known before you enter than discovered halfway in[cite: 22].
Super Seasonal Trade Desk
Unlock all three windows, 25% lighter.
Every plan carries the full weekly board, all twelve statistics on every pick, the backtest engine running to 1993, saved-filter email alerts, portfolios and exports[cite: 22].
Through Tuesday, code SS25 takes 25% off any plan[cite: 22].
Enter it at checkout. Ends Tuesday, October 6 at midnight.
Code SS25 applies 25% off at checkout and expires Tuesday, October 6 at midnight. Seasonal statistics describe past behaviour and do not guarantee future results.[cite: 22]