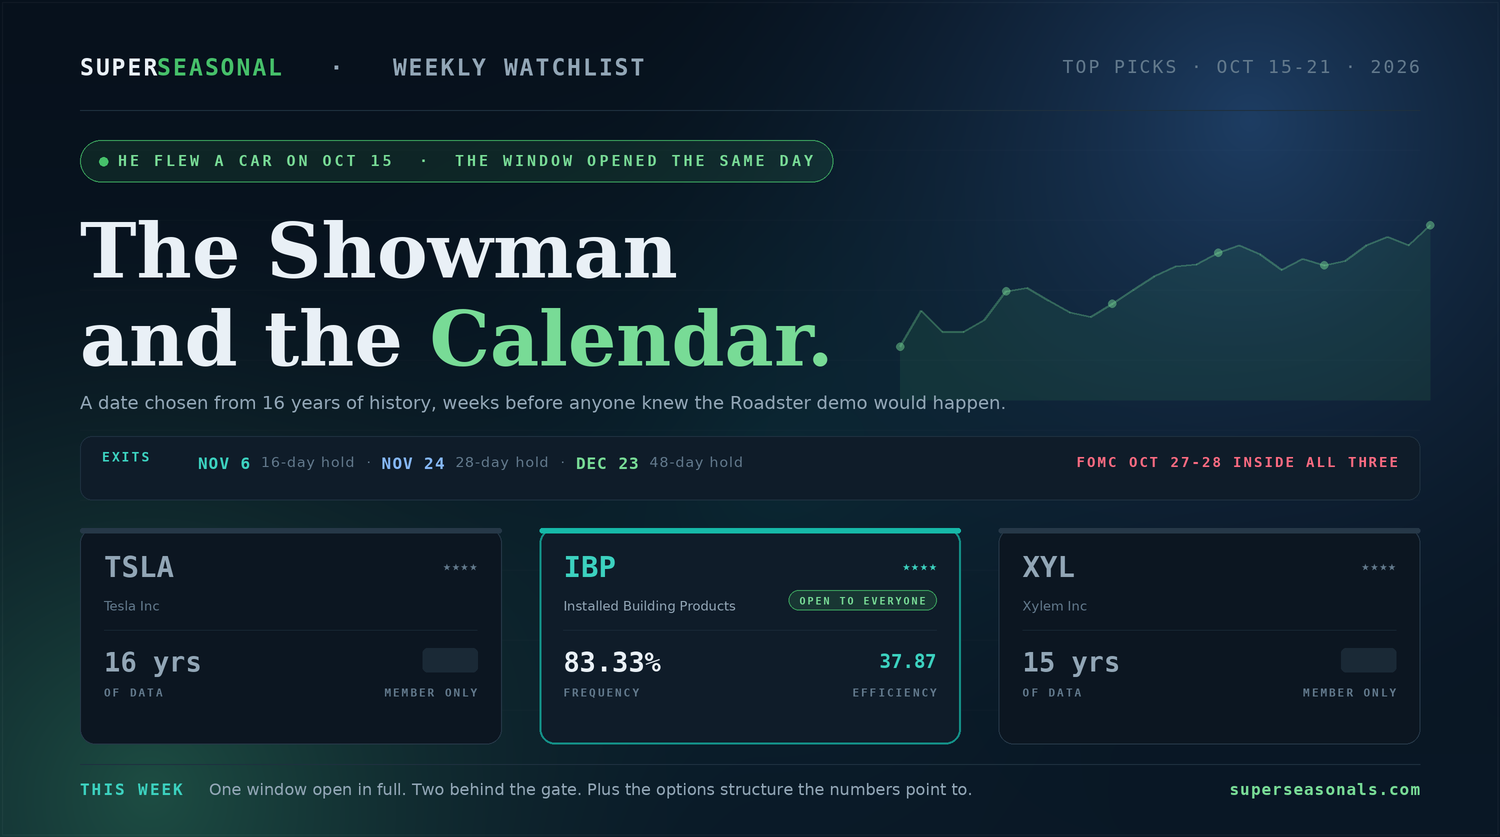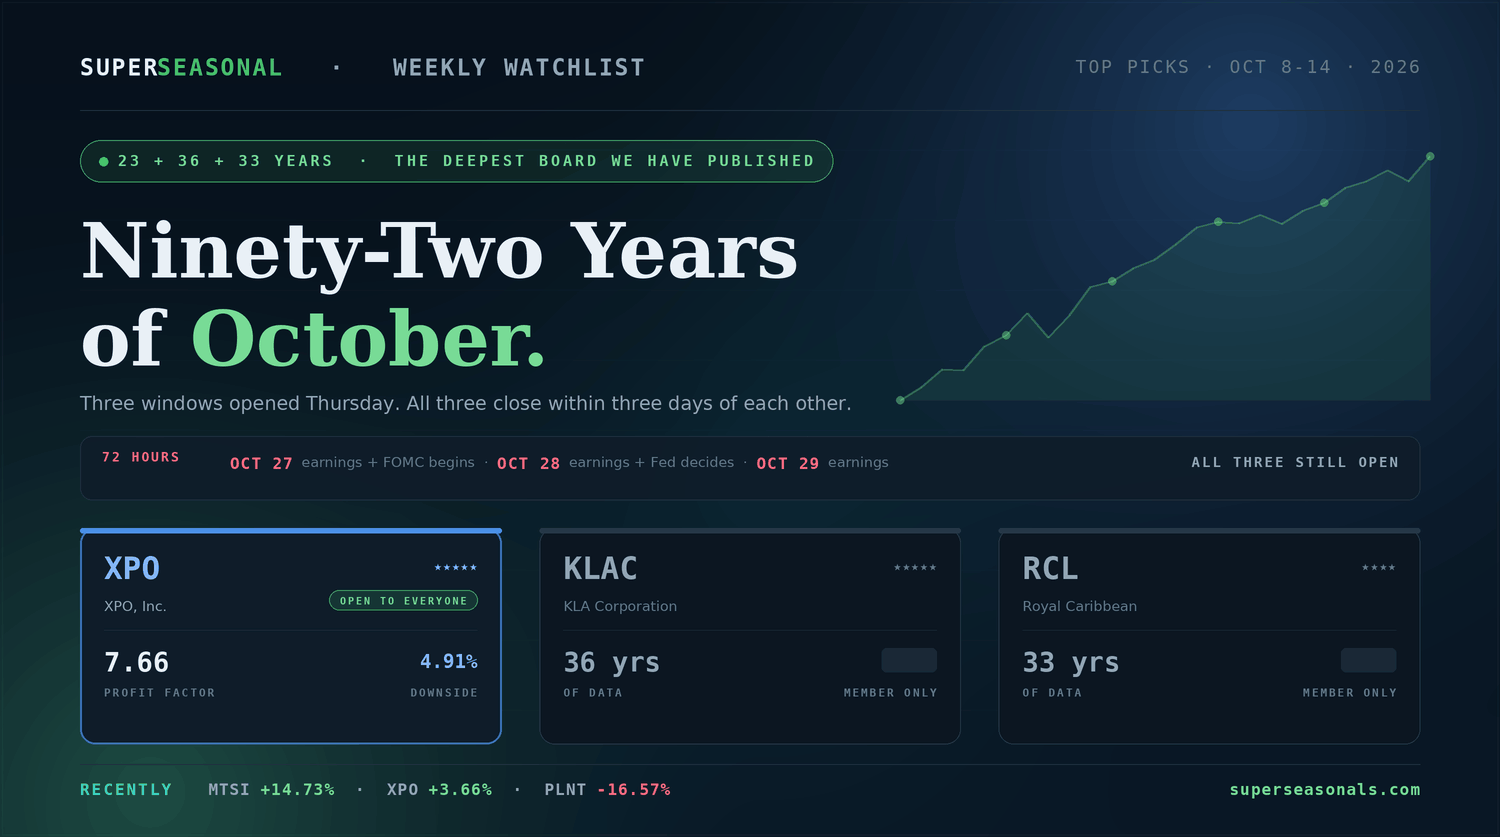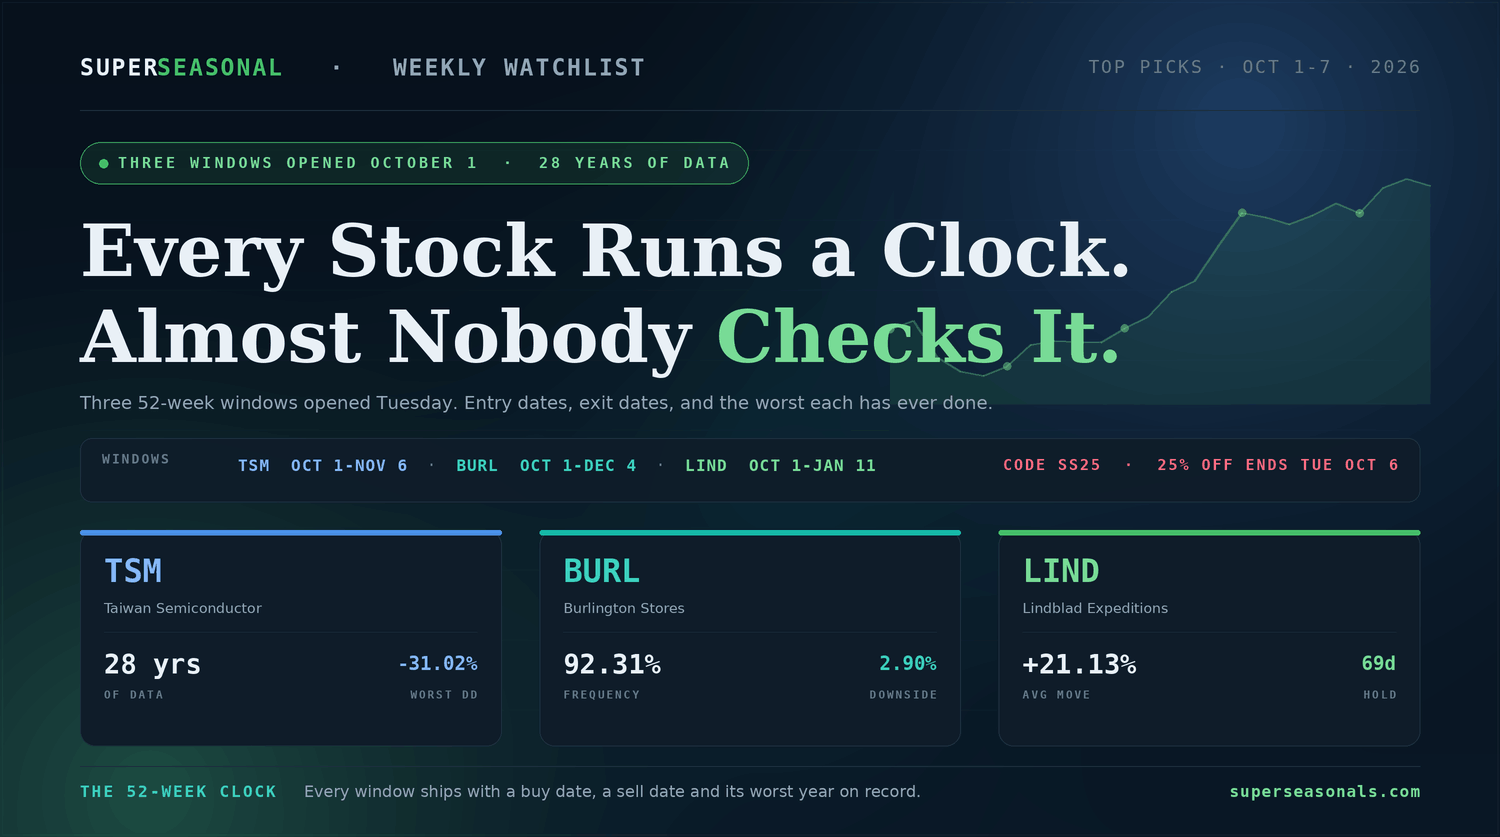
Peak Season.
Real Catalysts.
Week of August 24 — MGNX · HCI · CRM
This week the calendar stops being a metaphor. One of these names is driven by an actual season — and it's the one with the weakest numbers on the scan.
For once, the catalysts are inside the window
All summer we've said the seasonal window opens ahead of the catalysts. Not this week. Salesforce reports Wednesday, August 26 after the close — and it's on this list. The same evening brings Nvidia's report, the biggest sentiment event for the AI trade. And Chair Warsh speaks at Jackson Hole in late August, his most-watched appearance since the hawkish July meeting.
The backdrop is friendlier than a month ago: July CPI landed on consensus at 3.4% headline, 2.5% core — a second consecutive benign print — and September hike odds fell toward ~38%, with a hold near 62–64%. But July payrolls showed 23,000 jobs lost, a real warning on demand, and July PCE plus August payrolls still land before the Sept 15–16 FOMC.
This list spans about as wide a range of risk as we've ever run in one issue: a ~$250M clinical-stage cancer-drug developer, a Florida property insurer at the statistical peak of hurricane season, and a $158B software giant reporting mid-window. They share almost nothing. That is the point.
The honest tension, named up front: HCI has the strongest valuation case and the clearest real-world seasonality — and the weakest statistical profile of the three, leading in none of the four categories. MGNX has the biggest numbers and the most fragile balance sheet. CRM has the best frequency and the only binary event inside the week.
Two Workshops. One Complete Picture.
A seasonal watchlist tells you when the calendar is on your side. These two live sessions are about how you structure what you do next.
On September 9 you focus on the strategies themselves. On September 14 it goes a step further — instead of looking at every trade individually, you learn how different trades can potentially work together, and how that changes the way you think about risk, consistency, profit potential and compounding.
The scan leader
MGNX leads this week's scan on two of four categories: a 13.51 profit factor and 92.15% annualized return, with 85.71% frequency and a 75% win rate. That comfortably clears both other names here — more than double HCI's 5.25 and over four times Salesforce's 2.98 — while sitting well below the extremes we flagged earlier this summer in PANW (40.46) and ASND (39.48).
MacroGenics is a Rockville, Maryland clinical-stage biopharma developing antibody-based cancer therapeutics — antibody-drug conjugates, bispecific DART molecules and T-cell engagers — with collaborations spanning Incyte, Gilead, Sanofi and TerSera. A genuine micro-cap: shares trade around $3.50–$4 with a 52-week range of ~$1.19 to $4.64, market cap under $300M. Unlike some micro-caps we've covered, there is no reverse-split history distorting the price record.
Q1 2026 revenue came in at $20.78M against a $15.24M consensus — a substantial beat — and in June the company announced a $24.5M regulatory milestone payment from Sanofi. The clinical centerpiece is MGC026, a B7-H3-directed ADC: in July the Phase 1 study achieved its pre-specified Stage 1 response threshold in the head-and-neck cohort, with interim data accepted for poster presentation at ESMO Congress 2026. Non-dilutive royalty and manufacturing deals extend runway into 2028. Barclays raised its target to $6 (Overweight); B. Riley upgraded to Buy at $9; Stifel holds at Hold.
MacroGenics is unprofitable and clinical-stage. It reported a Q1 loss of 58 cents per share, carries roughly $105M of debt against a smaller cash balance, and analysts expect losses to widen in the coming year. Micro-cap biotech is binary by nature: a readout can move this 30% either way, and ESMO data is a two-sided event, not a guaranteed catalyst. Size this as a speculation you can afford to be wrong on.
Reported Q2 on July 23, 2026 — no earnings next week. The live catalyst is MGC026 interim Phase 1 data heading to ESMO Congress 2026, plus ongoing ADC and bispecific updates.
Disconnected from the Fed directly — no CPI print changes a Phase 1 readout. But small unprofitable biotech is among the most sentiment-sensitive corners of the market, so the receding September hike is a real background tailwind. Swing factors: clinical data and the balance sheet.
The strongest scan numbers this week — a 13.51 profit factor and 92.15% annualized return — on a genuinely improving story: a large Q1 revenue beat, a $24.5M Sanofi milestone, a B7-H3 ADC clearing Stage 1, and runway into 2028. But it's an unprofitable sub-$300M micro-cap with more debt than cash, heading into two-sided clinical data. Real catalyst, real fragility.
The literal season
We won't dress this up: HCI has the weakest statistical profile of the three and leads in none of the four categories. Its 5.25 profit factor does comfortably beat Salesforce's 2.98, but on the scan alone it's the least compelling name here. The case is built elsewhere.
Because here's what makes HCI unusual for this newsletter: its business is driven by an actual season. HCI is a Tampa-based property and casualty insurer — parent of Homeowners Choice, TypTap, Tailrow and CORE — writing primarily Florida homeowners coverage. Atlantic hurricane season runs June through November, and late August into September is its statistical peak. Every other name we've featured is seasonal in the sense that its chart has a pattern. HCI is seasonal in the sense that its earnings literally depend on the weather.
Q2 2026 diluted EPS came in at $5.60 against a $5.00 consensus, following a record Q1 of $5.45 vs $5.24. Book value per share surged 73.9% year-over-year to $84.41 — and management notes that excludes unrealized gains on its Exzeo platform and real estate, which they argue would put pro-forma book above $150. Trailing 36-month after-tax ROE has run near 35% — a period that included Hurricanes Milton and Helene. Dividends have been paid for 17 consecutive years ($0.40 quarterly), with an $80M buyback launched in March.
A P/E near 6.8, trading at less than 1.2× adjusted book, at roughly $178 against an average target near $238–$245 — implying 33% to 61% upside. Cantor Fitzgerald initiated in July at Buy with a $225 target, arguing the derating had gone too far given structural improvements in Florida's market. June's completed 2026–27 catastrophe reinsurance program raised aggregate excess-of-loss coverage 16% to $4.06B while lowering net cost, and the company is expanding via a new Geico partnership, the Exzeo platform and a tokenized reinsurance pilot.
HCI's fortunes are tied to Florida weather. A major landfalling hurricane during the coming weeks would hit results directly — Hurricane Milton alone drove a net $128M impact in 2024. The $4.06B reinsurance tower is genuine protection, not immunity, and retention still applies per event. Separately, the growth engine is slowing: Citizens' policy count has fallen 76% from its October 2023 peak to ~336,000, leaving far fewer takeout policies, and Florida's hard market is softening with carriers filing rate reductions. Ceded reinsurance premiums remain a large expense at ~$96M guided for Q3.
Reported Q2 on August 6, 2026 (EPS $5.60 vs $5.00) — no earnings next week. The live variable is the tropical weather calendar, alongside the Geico partnership and potential Exzeo monetization.
The least Fed-sensitive name here conventionally — a low-multiple insurer benefits modestly from stable rates through its investment portfolio, but no CPI print determines results. Its swing factor is meteorological, which is precisely why it belongs on a seasonal watchlist and precisely why it needs careful sizing.
The weakest scan profile here, winning no category — but the strongest fundamental case: Q2 EPS of $5.60 against $5.00 expected, book value up 73.9%, a 35% three-year ROE through two hurricanes, a 6.8 P/E under 1.2× adjusted book, and 33–61% analyst-implied upside. The catch is unavoidable and literal: concentrated Florida catastrophe exposure at the statistical peak of hurricane season.
The one that reports this week
CRM brings the highest frequency on the list at 86.36% and the best win rate at 76.19%, with an 87.47% annualized return.
Regular readers should note the numbers have improved since we last featured it: on August 3 this window showed a 2.37 profit factor and 70.38% annualized, against 2.98 and 87.47% today. The profit factor is still the lowest of these three — this remains a choppier setup than its frequency suggests.
Fundamentals have never been the problem. Salesforce is the largest pure-play enterprise-software company in the world, and its May quarter beat convincingly — adjusted EPS of $3.88 against $3.13 expected, revenue of $11.13B up 13.3%, with record margins. The stock has recovered from the ~$180 level where we flagged it August 3 to about $191–$193, up nearly 15% over the past month. Short interest fell 36.7% in the second half of July.
Salesforce reports Q2 FY2027 on Wednesday, August 26 after the close — inside this window. Consensus looks for ~$3.27 EPS on ~$11.3B revenue. The specific question: is Agentforce converting into billed consumption fast enough to answer the seat-based-software fear that has defined CRM all year? Analysts have raised targets into the print — Citi to $204, UBS to $210, Wells Fargo to $205, JPMorgan resuming Overweight at $250 — against an average near $242.
Through 2026, essentially every prominent bull call on Salesforce has produced a pop the stock then gave back — Citigroup's July upgrade, Guggenheim's move to Buy at $228, Monness Crespi's $222, and the rest. Note also that several recent target increases came from analysts holding Neutral or Equal-Weight ratings — raising numbers while explicitly cautioning on second-half revenue acceleration. Earnings inside the window cuts both ways: a genuine catalyst, and genuine gap risk in a name whose upgrades keep failing to stick.
Wednesday, August 26, 2026, after the close (confirmed) — inside this week's window. Watch Agentforce consumption billing and cRPO. Nvidia reports the same evening.
A mega-cap software multiple that benefits from the softer print and receding hike — but it has de-rated so far already that the macro is not the main event. The swing factor is Wednesday night, and specifically whether Agentforce monetization shows up in the numbers rather than the narrative.
Best frequency and win rate here, an improved profit factor since our August 3 issue, and a genuine catalyst inside the window. But it's the only name carrying binary earnings-gap risk during the week, its 2.98 profit factor is still the lowest of the three, and 2026's upgrade cycle has repeatedly failed to hold. Position for the print, or wait for it — but don't confuse the two.
The three setups, side by side
| Ticker | Frequency | Profit Factor | Ann. Return | Annual Win % | Catalyst |
|---|---|---|---|---|---|
| MGNXMacroGenics | 85.71% | 13.51 | 92.15% | 75% | ESMO data ahead |
| HCIHCI Group | 82.35% | 5.25 | 74.86% | 70.59% | Peak hurricane season |
| CRMSalesforce | 86.36% | 2.98 | 87.47% | 76.19% | Earnings Aug 26 · in-window |
The Big Picture
Three names, three genuinely different kinds of risk — chosen so that no single assumption decides the week.
Notice that these three fail for completely unrelated reasons. MacroGenics is undone by a bad data readout. HCI is undone by a storm making landfall. Salesforce is undone by a soft Agentforce number on Wednesday night. There is no single event that damages all three — which is exactly what you want heading into a week containing an earnings print, an Nvidia report and a Jackson Hole speech.
The structural point bears repeating: in recent weeks the window opened ahead of the catalysts. This week it does not for Salesforce — so deciding in advance whether you want to be in that name before the print or after it is a real decision, made deliberately rather than by default. Meanwhile HCI's risk runs on a calendar nobody controls. Watch the price action, respect your stops, and refuse to let emotion decide.
Sign Up to View Full Trade DetailsSuper Seasonal Trade Desk
Don't Stop With the Strategy. Learn How to Combine It.
Attending the September 9 Strategy Workshop? You can add the LIVE Cash Flow Combination Workshop on September 14 and go from trading setups one at a time to thinking about how multiple positions can work as one.
The idea behind Profit Stacking: if a trade carries $3,000 of risk and a properly structured combination reduces that exposure to $1,000 while attempting to preserve the original profit potential, you have potentially freed up $2,000 of risk you were already willing to take — capital you may be able to deploy into another quality opportunity.
Attendee-exclusive pricing. Examples shown are illustrative of the concepts taught and are not a projection of results; combining option positions involves risk, including the risk of loss. Nothing here is personalized financial advice.